.png)
One Step Closer To Zero Pipeline Incidents: Fixing a Broken Approach to POE Calculations
- Dec 5, 2021
- 7 min read
The Canadian Pipeline Industry’s Billion Dollar Problem
Pipeline networks are a safe and reliable way to transport Oil & Gas products to the market and are economically vital to the industry. In 2020, major Canadian pipeline companies (CEPA) transferred 1.3B barrels of crude oil and 4.5T ft3 of natural gas to the market through a complex network of 100,000 km pipelines across North America.
Running these aging infrastructures safely has always been a challenge for pipeline operators. Pipeline companies spend billions of dollars to maintain and monitor their pipelines and run them safely and reliably. There are strict regulations and standards to make sure pipeline companies are doing everything they should to prevent pipeline incidents and be ready for any emergencies and consequences. In 2020 alone, CEPA members conducted in-line inspection runs on 35,556 kilometres of their pipelines to identify issues in the pipeline and performed 1,737 integrity digs to repair those issues.They also invested $1.2 billion in maintenance and monitoring of their Canadian pipeline systems, and $10.6 million in innovative technology focused on reducing pipeline corrosion and improving pipeline inspection, leak detection and damage prevention. (Source: CEPA 2020 Pipeline Performance Report)
Despite all the investment into pipeline inspections, planning, and repairs, incidents still happen. There were 19 incidents in natural gas and liquid pipelines operated by CEPA in 2020, an increase of 10 over the previous year (Figure 1).

Figure 1: Pipeline incidents trend over the time (CEPA)
Preventing pipelines from failing and achieving zero incidents has always been the industry goal, but this increase shows that traditional integrity decision making is not sufficient to prevent incidents from happening.
The Pipeline industry requires innovative and effective decision making methods that are supported with data and analytics, and are proactive, fast, and repeatable. This is especially true considering the tremendous amount of data that is generated every year from inline inspections and all the uncertainties that naturally come with ILI measurements, aging and old pipeline infrastructures, an environment that is changing constantly and increasingly complex, and more strict rules and regulations.

Preventing Pipeline Failure
Integrity digs are performed to take actions to repair the defects identified through inline inspections. These actions are necessary to repair the sections of the pipeline that are likely going to fail and cause incidents. Most digs are not pre-scheduled and integrity specialists have to plan them every year. However, there is no straight and effective method to schedule these digs and prioritize repairs in the most time and cost-effective manner. This results in either doing too many digs or not digging the necessary sections. Both of these scenarios have consequences -- unnecessary digs are inherently costly. Alternatively, not digging the problematic sections early enough will result in pipeline failure, and all the environmental and financial consequences that come with it.
Inline inspection data is the main data source for repairs and integrity dig planning. But ILI data comes with errors in detecting and sizing the defects, which makes the estimation not so accurate. ILI measurements of detected anomalies do not always represent the actual size of that anomaly and are vulnerable to a certain degree of errors. Tool performance is not the same for different vendors and technologies, nor is it the same for pipelines based on their characteristics and operating conditions. Currently, the majority of the pipeline industry uses vendor-reported errors and industry default values. These values may be good starting points, but are not the most accurate measures for a time and cost-effective dig plan.
These uncertainties in addition to inefficiencies in traditional calculations and processes, result in late repair schedules and pipeline failures.
POE: A Critical Factor
Probability of Exceedance (POE) is the likelihood that a defect detected by ILI exceeds the acceptable criteria. POE is the main driver for a number of integrity decisions, such as dig planning and prioritizing. Current methodology to calculate POE is very generic and doesn’t take into account variations in pipe specifications and uncertainties in ILI measurements. Defect growth rates are also linear and constant across pipelines. These result in inaccurate POE and time to failure of defects for timely dig planning.
Having more accurate POE eliminates the cost of unnecessary digs, reduces the chance of incidents by better dig planning and prioritization, leads to better and more timely integrity management, risk and mitigation planning, and reduces the cost of unnecessary re-inspections.
The Difficulty of POE Calculations
Corrosion defects are the major threats that cause pipeline failures. In 2020, 57% of incidents reported by CEPA were due to metal loss through corrosion. There have been advances in corrosion prevention methods and detection technologies through inline inspection tools. But due to the growth mechanism of corrosion defects and errors in ILI data, there are always uncertainties associated with detecting and sizing these defects, and estimating their time to failure.
To be able to schedule the repairs before defect failure, integrity specialists need to know a few things:
What was the true size of the defect at the time of ILI?
How much has it grown since?
And when will it be deep enough to fail the criteria?
Answering these questions is difficult due to the way ILI measures the corrosion depth. On top of that, pipeline actual specs are often different from nominal values and corrosion growth rates over the time are unknown and inconsistent for different sections of the pipeline, further complicating the problem.
One solution is to use the Probability of Exceedance (POE) as a measure of the likelihood of a corrosion defect to fail the industry standard criteria. Currently, POE is calculated using a deterministic statistical method with a single point value of variables from inline inspection measurements, pipe specifications, and growth rates. These parameters are not consistent across a specific pipeline and for specific defects due to inconsistencies in pipe characteristics and design, uncertainties in inline inspection detection and measurements of defect and different growth rates in the pipe environment and over the time.
Current POE calculations do not take into account variations in pipe characteristics and uncertainties in ILI measurements, though. The assumption of linear and consistent growth rates across the pipeline result in over-calling POE in newer pipelines and under-calling it in older pipelines with more failure susceptibility.
Getting to a More Accurate POE with the Monte Carlo Simulation
In order to account for all of the variations and errors in POE calculation, Integra leverages the Monte Carlo Simulation method to simulate POE by generating millions of scenarios for a defect to fail the criteria and uses its cloud-based platform, Digital Hub, to run the simulation for hundreds of thousands of defects across pipelines in a time and cost-effective manner.
Running the Monte Carlo Simulation at this scale has its own challenges. As we have previously discussed in The Power of the Monte Carlo Simulation & How to Use It, there are three major roadblocks in utilizing Monte Carlo Simulation applications.
Lack of right infrastructure to run the simulation in a cost and time effective manner
Failure to define the right distributions for input parameters
Inefficient sample size in designing the simulation

In the past, we’ve addressed how a lack of proper infrastructure also has direct limits on the use of MCS. As noted, we can mitigate this by leveraging highly scalable open-source data science technologies, such as those found on Digital Hub, which allow for parallel processing to help account for this influx of data.
For today’s purposes, we are going to cover the other two challenges when attempting to simulate failure of corrosion defects: accounting for variations in input parameters and right-sizing our samples.
Problem: Failure to define the right distributions for input parameters
As shown in the diagram below (Figure 2), instead of single values, MCS uses distributions of input variables to simulate the outcome through repeating the “sample -> substitute -> solve” process millions of times.

Figure 2: Monte Carlo Simulation diagram
These distributions should be truly representative of the parameters and failure to define them accurately will impact the simulation result. This requires deep knowledge of the behaviour of these variables both individually and in relationship with others, as well as the ability to translate that knowledge into available and existing data and define the right distribution for each input.
Our Solution: Leverage distributions to account for variations and uncertainties
In Integra’s pipeline failure simulation, industry standard distributions of input variables are used instead of single values (Figure 3). Sampling from these distributions in each iteration accounts for variations and uncertainties and generates probable scenarios of pipe characteristics, defect measurements, and growth rates to more accurately calculate the POE value for those scenarios.

Figure 3: Input distributions used to calculate POE in Integra’s pipeline failure simulator
Problem: Inefficient sample size when designing the simulation
MCS is a computationally intensive solution and it can very expensive, very quickly. With the right sample size, companies can reduce the compute, time, and cost, and still achieve the desired accuracy. Optimizing sample size for different scenarios and thresholds will allow organizations to run the simulation at scale and cost/time effectively. For any use case, the ability to determine proper sampling size is a delicate balance between solution credibility and cost. Larger sample sizes allow for the detection of rare events and increase certainty, but they come with the price of computation power and time.
Our Solution: Optimize computation through tailored and intelligent sampling
Integra implemented a dynamic system to determine the amount of simulations needed for each pipeline defect. The sampling size is estimated by using deterministic calculations of the expected result, which is then associated with a range of sampling sizes through rigorous tests and experimentations. Our dynamic approach enables intelligence to the algorithm in allocating computation resources. For instance, the algorithm recognizes that large defects are more likely to fail the criteria and require fewer simulations to detect failure possibilities.
Sample Report: Simulating Pipeline Failure for Wide Range of Defect Size
Using a simulated ILI dataset, we have included a sample reporting structure for identifying and pre-empting corrosion defects utilizing the methods and tactics outlined above.
There are 50 identified corrosion features in the sample data with size distribution shown in Figure 4. POE is simulated 1.0E+7 times for each defect and it is forecasted for 10 years. The simulator generates a report with insights on dig recommendations and time to failure forecast for each defect.
Sample ILI Report
A basic view of the ILI data is given to gain insights into the distribution of corrosion defects and the proportion of defects in each severity class.

Figure 4: Sample ILI data summary and defects size distribution
Immediate Dig Recommendation
The simulator flags the defects that are going to fail the criteria within a year after ILI run (Figure 5) and generates the POE and depth percent distribution for each defect (Figure 6).

Figure 5: Severe defects size distribution and POE value

Figure 6: Depth and POE distributions for severe defects
5-year Dig Recommendation
The simulator reports the defects that are recommended to be repaired within five years (Figure 7) and their years-to-failure in addition to the 10-year POE forecast (Figure 8).

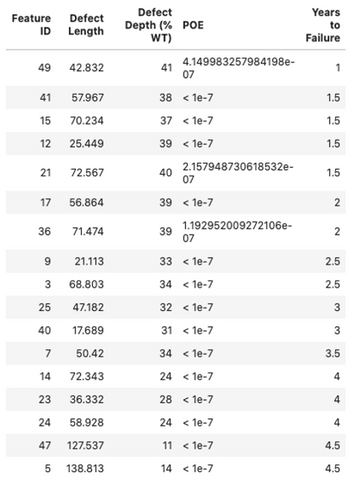

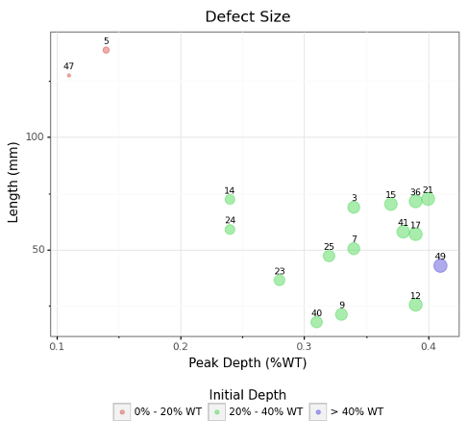
Figure 7: Size distribution of defects that fail within 5 years

Figure 8: 10-year POE forecast
Long-Range Dig Recommendation
Defects that do not need immediate or ASARP repair are identified in this section of the report (Figure 9). 10-year POE forecast and years-to-failure for each defect is reported (Figure 10).

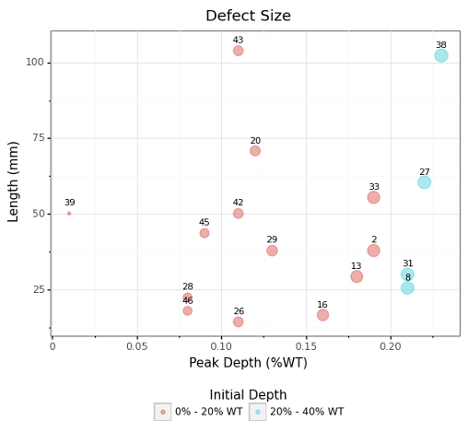

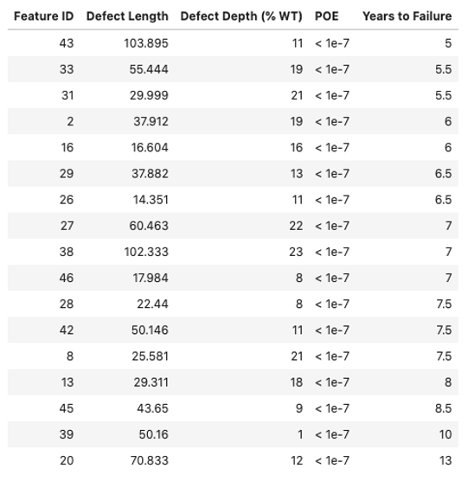
Figure 9: Size distribution for defects that fail after 5 years

Figure 10: 10-year POE forecast
Integra’s innovative solution for pipeline failure helps pipeline operators make their integrity decisions with more confidence, resulting in reduced risk of failures and cost of unnecessary repairs. If you are interested to learn more about Integra's Pipeline Failure Simulation email us at info@integradas.ca.